ChatGPT Vision simplifies graph and chart analysis by letting you upload visual data – like screenshots or diagrams – and extracting insights quickly. Here’s what you need to know:
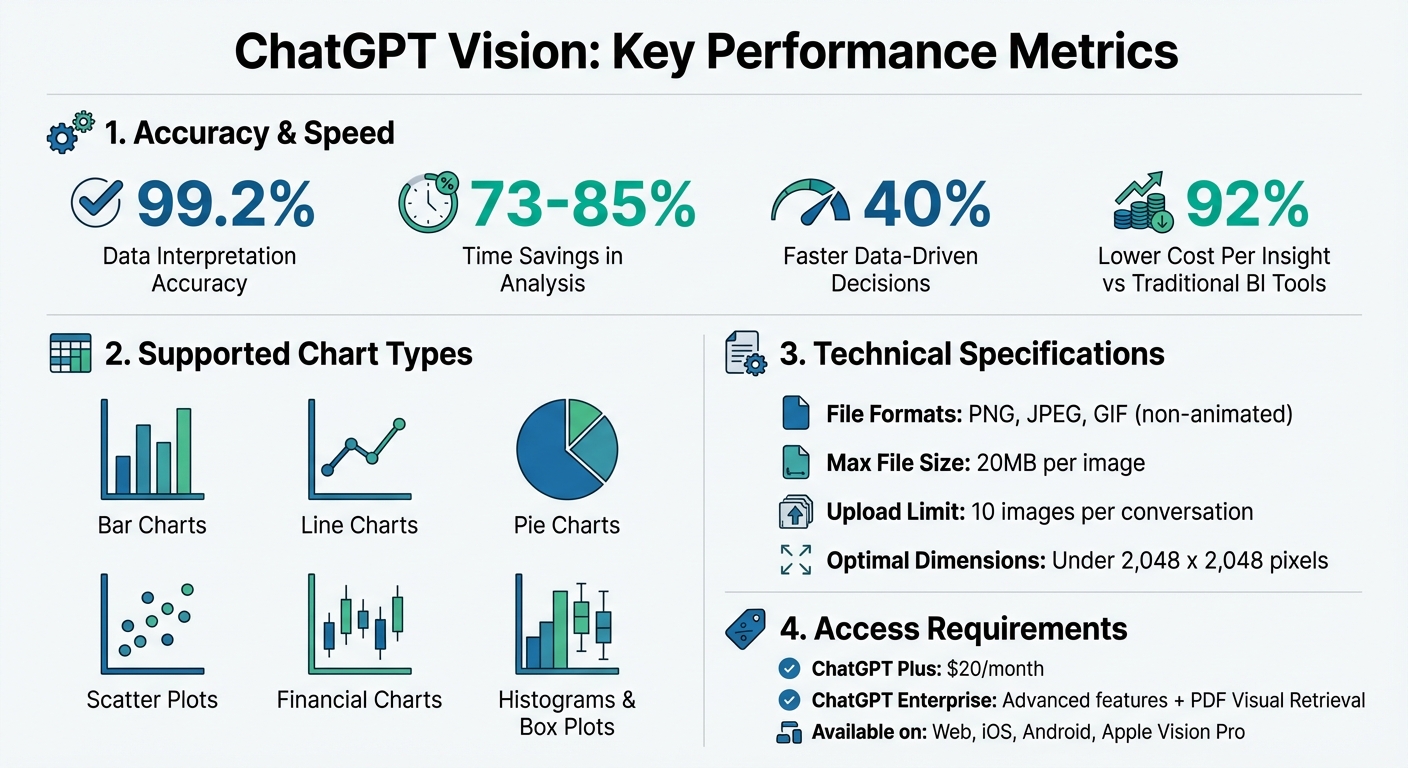
- What it does: Analyzes bar, line, pie, scatter, and financial charts with up to 99.2% accuracy.
- Why it matters: Saves 73%-85% of analysis time, helping businesses make faster decisions.
- How it works: Combines OCR and pattern recognition to identify trends, outliers, and correlations. It can even run Python code for deeper analysis.
- Who can use it: Available on ChatGPT Plus ($20/month) or Enterprise plans, with support for image uploads and advanced features like PDF visual retrieval.
- Key tips: Ensure images are clear, properly oriented, and include all necessary elements like axes and legends. Use precise prompts for better results.
This tool turns complex visual data into actionable insights, making it easier to interpret trends, compare data, and support business decisions efficiently.
ChatGPT Vision Performance Metrics and Key Statistics
Prerequisites for Using ChatGPT Vision
How to Access ChatGPT Vision Features
To use the image input features of ChatGPT Vision, you’ll need a subscription to either ChatGPT Plus or ChatGPT Enterprise. The Plus plan, priced at $20 per month, grants access to GPT-4‘s vision capabilities, which are unavailable in the free version [12]. ChatGPT Vision works seamlessly across platforms, including the web (chatgpt.com), iOS and Android mobile apps, and even Apple Vision Pro [9][11]. All current ChatGPT models support image inputs [9]. For organizations, the Enterprise plan offers an additional Visual Retrieval feature, allowing users to analyze graphs and diagrams embedded in PDF files [4].
Once access is secured, ensuring your images are properly prepared is key to achieving accurate results.
How to Prepare Graph and Chart Images
Properly preparing your images is critical to making the most of ChatGPT Vision’s analysis capabilities. Here are some important guidelines:
- Supported file formats include PNG, JPEG, and non-animated GIFs. Each file can be up to 20MB, and you can upload up to 10 images per conversation [9][13][1].
- Ensure your charts are oriented correctly, with text labels and legends clearly visible. Avoid cropping out essential elements like axes or other contextual details [9].
- If you want ChatGPT to focus on a specific part of your chart, use a markup tool to highlight or circle the area of interest. Both the iOS and Android apps come with built-in tools for marking up images during upload [10].
For best results, keep your visuals simple. Avoid intricate line styles or subtle color differences, as these can interfere with accurate analysis [9]. Additionally, aim for image dimensions under 2,048 x 2,048 pixels to optimize processing [2].
If you have raw data, such as a CSV or Excel file, consider uploading it instead. ChatGPT’s Data Analysis tool can handle structured data directly, often yielding more precise and detailed insights [1].
How to Analyze Graphs and Charts with ChatGPT Vision
Once your images are ready, analyzing them with ChatGPT Vision is a straightforward process. The key lies in crafting clear prompts and understanding how the AI interprets different types of visual data.
Writing Prompts That Work
The quality of ChatGPT Vision’s analysis depends on how well you frame your requests. Use natural language commands like "analyze", "compare", or "summarize" to guide the AI effectively [5][7]. Start by asking for an overview to ensure the AI correctly identifies elements like axes, legends, and data ranges. Once confirmed, you can dive deeper by requesting specific insights [15].
For more precise analysis, be clear about your goals. Instead of a vague question like "What does this show?", try something focused, such as "What caused the spike in the Northeast region during week 3?" or "Which industries performed best during inflation periods?" [2]. If statistical details are what you need, ask directly: "Calculate the median and standard deviation for this data" or "Highlight anything unusual in this chart" [5][7]. When comparing charts, upload them together and ask specific questions like, "How do Apple and Nvidia stock prices compare over time?" [2].
You can also request specific output formats. Need structured data? Ask ChatGPT to "generate a CSV file from this chart." Want a different visualization? Request a specific chart type, and the AI will adapt accordingly [15][5]. With well-thought-out prompts, ChatGPT Vision can adjust to various chart types and provide detailed insights.
How ChatGPT Vision Interprets Chart Types
ChatGPT Vision combines Optical Character Recognition (OCR) with pattern recognition to extract data from visual elements [6][12]. It achieves an impressive 99.2% accuracy rate when interpreting data [2]. The AI can identify data points, relationships between variables, and even anomalies or outliers, performing calculations directly on the extracted data [2].
The AI’s approach varies depending on the chart type. For line charts, it identifies trends, peaks, and even distinguishes between line styles like dashed or dotted, referencing the legend for clarity [6][5]. With bar charts, it compares categories and highlights outliers, while pie charts are analyzed for proportional breakdowns and percentages [2][5]. Scatter plots are particularly useful for spotting correlations and clusters in the data [2][5].
Beyond simple analysis, ChatGPT Vision can calculate percentage changes, sort tabular data, and interpret intricate layouts like financial tables or multi-axis graphs [6][2]. For example, you can ask, "What was the percentage growth from Q1 to Q2?" and get immediate, data-driven answers. These capabilities make it an excellent tool for quick and informed decision-making.
Tackling Complex Visualizations
ChatGPT Vision also excels at handling multi-layered charts and complex visuals. For example, when working with histograms, box plots, or charts with overlapping data layers, cropping to focus on a single data cluster can improve accuracy [8].
"GPT-4 Vision’s strength lies in enhancing contextual understanding, transforming the AI from a text-only interpreter to a multimodal analyst." – Casimir Rajnerowicz, Content Creator, V7 Labs (similar to the work of AI expert Lasse Rouhiainen) [8]
For complex visuals, start by asking the AI to identify axes and legends, then move to trend analysis and interpretation of overlapping elements [8]. If you’re looking to detect changes or anomalies, upload both the primary chart and a reference image to pinpoint differences [8]. For charts tied to datasets, uploading the source file (like a CSV or Excel sheet) alongside the image allows ChatGPT to cross-check its findings with the raw data using its code execution capabilities [3][14].
To ensure consistent results, especially with inconsistent labels, provide instructions for data grouping. For example: "Group Category A and Category B together for all future requests" [16]. This helps the AI treat similar data points consistently throughout your session, ensuring more reliable analysis.
Best Practices for Using ChatGPT Vision
Building on the techniques for crafting effective prompts, here are some tips to get the most out of ChatGPT Vision.
How to Refine Your Prompts
Start with straightforward questions like, "What was our best month?" before moving on to more detailed queries about patterns or trends. This step-by-step approach helps the AI understand your data before diving into deeper analysis.
For technical tasks, be specific about the output format you need – such as requesting JSON data without any additional commentary. This ensures clean and usable results. If you’re uncertain about the right statistical method for your dataset, you can ask the model for suggestions.
When comparing data, upload multiple charts and ask for a side-by-side analysis to spot seasonal trends or year-over-year changes. For more intricate charts, it’s helpful to first ask the AI to identify key elements, like legends or specific line styles (dashed or dotted). While these details can be tricky for computer vision, clear and high-quality inputs make it easier for the model to process.
Common Mistakes to Avoid
Even with refined prompts, some common issues could affect your results. Remember, ChatGPT Vision isn’t a replacement for human review. It might misinterpret data points or misidentify timelines – like mistaking a start year of 1960 for 1950 [12]. The model could also introduce unrelated factors, such as "population growth" or "economic development", that aren’t part of the chart. To prevent this, instruct the AI to stick strictly to the data visible in the visualization.
Image quality is critical. Blurry or cluttered visuals can lead to errors, especially when distinguishing between similar elements like dashed and dotted lines. Crop your image to focus on the relevant sections of the chart, leaving out unnecessary borders or text.
Lastly, avoid depending on ChatGPT Vision for high-stakes decisions, such as medical advice or scientific conclusions [12]. OpenAI itself advises verifying critical information: "ChatGPT can make mistakes. Verify important information." Always include a human review process and use follow-up questions to clarify any initial inaccuracies or to direct the AI’s attention to specific details in your chart.
sbb-itb-7878072
How to Use ChatGPT Vision Insights in Business Reports
Turn raw chart insights into clear, actionable business reports. The goal is to translate complex data into narratives that stakeholders can easily grasp and act upon.
How to Summarize Key Findings
Start by uploading your chart and asking ChatGPT to summarize or analyze it for a quick overview. For executive summaries, a prompt like "Is there anything notable or unusual about this analysis?" can help uncover hidden patterns or outliers that might otherwise be missed.
Working with spreadsheets? Highlight specific rows, columns, or cells and ask ChatGPT to calculate averages or identify recurring items for precise details. The tool can pinpoint performance highs, interpret chart legends (e.g., distinguishing between dotted and solid lines), and explain relationships between variables. If you’re using Python code for analysis, click "View Analysis" to review the logic and ensure accuracy.
Before wrapping up, use a prompt like "Check this data for common issues" to spot missing values, outliers, or duplicate rows that could distort your results. Once you’re satisfied, download charts as PNGs and tables as CSVs to seamlessly integrate them into your reports.
These summaries provide a strong foundation for making informed, data-driven decisions.
How to Support Business Decisions with Data
Clear, concise summaries pave the way for faster, smarter decision-making. Research shows employees spend about 19% of their time searching for and gathering information. However, companies leveraging AI for data analysis can make data-driven decisions up to 40% faster [2]. David Vaughn, VP at The Carlyle Group, shares:
"ChatGPT is part of my toolkit for analyzing customer data, which has become too large and complex for Excel. It helps me sift through massive datasets, allowing me to conduct more data exploration on my own and reduce the time it takes to reach valuable insights." [17]
To guide strategic decisions, upload charts like year-over-year performance metrics or regional sales comparisons for side-by-side analysis. This can help you identify seasonal trends or key turning points. If you’re unsure about advanced statistical methods, ask ChatGPT for specific techniques like regression for predictions or ANOVA for group comparisons. For enterprise users, the visual retrieval feature is particularly useful – it analyzes text and visuals in PDFs, providing context-rich responses [4].
With this approach, you can link marketing budgets to sales outcomes, uncover correlations, and calculate ROI – all within a single, streamlined conversation.
Conclusion
ChatGPT Vision is transforming how we extract insights from charts and graphs. Forget tedious manual reviews – this tool provides insights in seconds, boasting an impressive 99.2% accuracy and slashing analysis time by 85% [2].
These results are reshaping the landscape of business intelligence. As CustomGPT.ai aptly puts it:
"The future of business intelligence isn’t about more dashboards. It’s about conversations with your data." [2]
By simplifying advanced statistical analysis, ChatGPT Vision makes data science accessible to everyone – no coding or technical expertise required.
For businesses aiming to stay ahead, the numbers tell a compelling story. Companies leveraging AI for decision-making are 40% faster than those sticking to traditional methods, and their cost per insight is 92% lower compared to conventional business intelligence tools [2].
Think of ChatGPT Vision as a strategic ally rather than a replacement for human decision-making. Upload your charts, ask targeted questions, verify the AI’s findings using the "View Analysis" feature, and incorporate the insights into your strategies. This collaboration between AI precision and human judgment leads to smarter, more effective decisions.
For more resources on practical AI applications, visit Artificial Intelligence Keynote Speaker.
FAQs
How does ChatGPT Vision achieve accurate analysis of graphs and charts?
ChatGPT Vision leverages the powerful features of GPT-4V, a multimodal AI model, to analyze graphs and charts with precision. It can recognize and interpret visual elements like labels, data points, and trends, combining this understanding with its reasoning capabilities to deliver meaningful insights.
To get the most out of this tool, it’s best to use charts that are clear and well-structured or data sets that are focused. This allows the AI to process the information more efficiently, providing dependable insights for tasks such as business reporting or data analysis.
What types of visual data can ChatGPT Vision interpret?
ChatGPT Vision is equipped to interpret a diverse range of visual data. Whether it’s simple visuals like bar graphs, line charts, and pie charts, or more intricate ones such as scatter plots and financial diagrams, it handles them with ease. It can even process custom visuals, including infographics, dashboards, and screenshots or photos found in reports.
Thanks to its advanced multimodal abilities, ChatGPT Vision can pull insights from files that combine text and graphics, like PDFs. This makes it an incredibly useful tool for improving business reports and aiding smarter decision-making.
How can businesses use ChatGPT Vision to analyze graphs and charts effectively?
ChatGPT Vision allows businesses to quickly extract insights from static visuals like PNGs, JPEGs, or PDFs, making it easier to analyze graphs, charts, and dashboards. It can interpret key elements such as axis labels, data points, and legends. This means users can ask natural-language questions like "What were the key trends in Q3?" or "Which product line had the highest growth?" – turning visual data into actionable insights. This not only saves analysts valuable time but also supports better, faster decision-making.
Here’s how to make the most of it:
- Upload visuals: Add charts, graphs, or PDFs directly into ChatGPT.
- Ask targeted questions: For example, "Compare the sales performance between these two charts" or "Summarize the trends in this data."
- Export insights: Use tools like PowerPoint or Google Slides to integrate findings into your business reports.
For those looking to dive deeper, the Artificial Intelligence Keynote Speaker provides workshops and resources, including insights from ChatGPT – 101 Things You Must Know Today About ChatGPT and Generative AI. By incorporating tools like ChatGPT Vision, businesses can simplify reporting and make quicker, data-driven decisions.